MyPC Cloud Reports
MyPC Cloud has built in reporting with visual graphs. Reports available are as follows; • User reports • Room reports • Desk reports • Computer reports
User reports
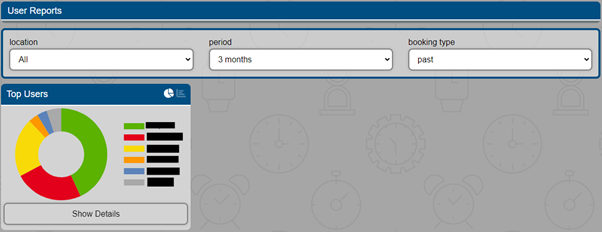
You can change the location, period you wish to see and booking type. You can also change which graph format you prefer.
Changing the location
- Select the location you wish to report on, this can be for all locations or per location.

Changing the period
- Select the length of time you wish you report on, this can be 1 month, 3 months, 6 months and 1 yr.

Changing the booking type
- Select from past or future bookings.

Changing the Graph format
- There are two types of graphs you utilise, Pie or Bar.

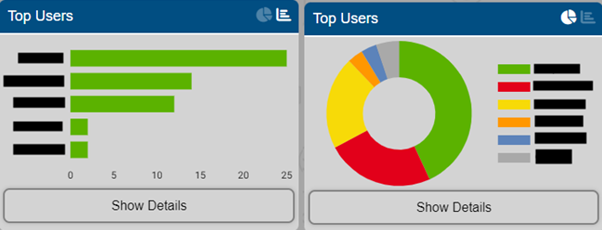
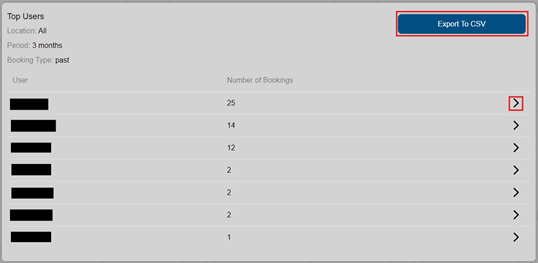
Reading the graph, show details
- You can expand the graph data by clicking on show details.
- This will display the data plus the option to export the data to CSV.
- You can click on each user to expand on the individual bookings they made.
Room Reports
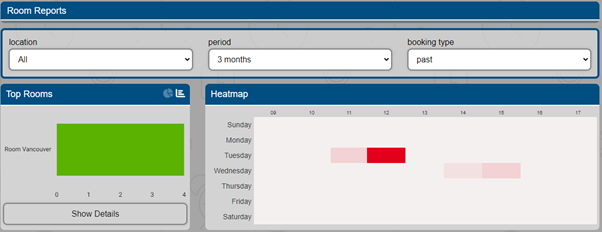
You can change the location, period you wish to see and booking type. You can also change which graph format you prefer.
Changing the location
- Select the location you wish to report on, this can be for all locations or per location.

Changing the period
- Select the length of time you wish you report on, this can be 1 month, 3 months, 6monts and a yr.

Changing the booking type
- Select from past or future bookings.

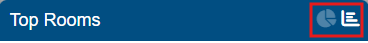
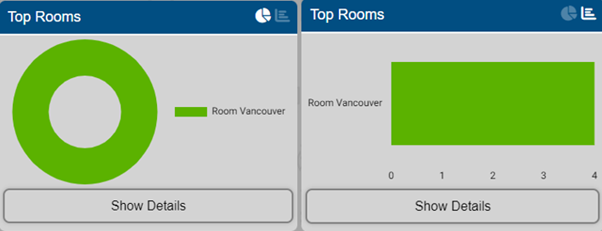
Changing the Graph format
- There are two types of graphs you utilise, Pie or Bar.
- There is a heatmap available to show you which days are busier than others. This will help determine any rule changes.

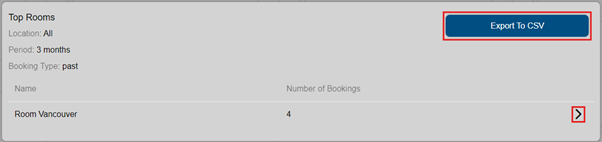
Reading the graph, show details
- You can expand the graph data by clicking on show details.
- This will display the data plus the option to export the data to CSV.
- You can click on each entry to expand on who made the bookings including date start and end time.
Desk Reports
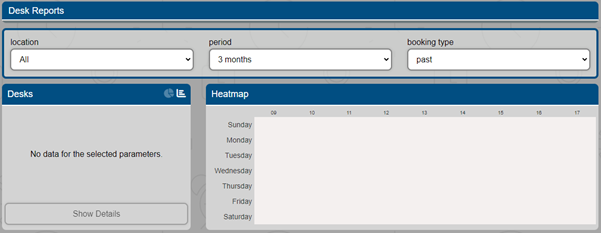
You can change the location, period you wish to see and booking type. You can also change which graph format you prefer.
Changing the location
- Select the location you wish to report on, this can be for all locations or per location.

Changing the period
- Select the length of time you wish you report on, this can be 1 month, 3 months, 6monts and a yr.

Changing the booking type
- Select from past or future bookings.

Changing the Graph format
- There are two types of graphs you utilise, Pie or Bar.

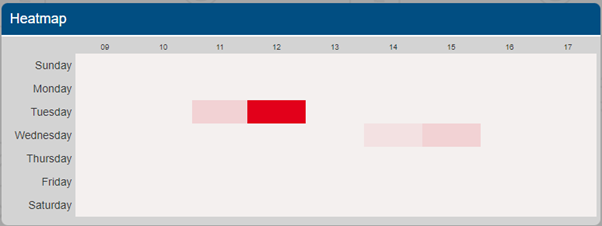
- There is a heatmap available to show you which days are busier than others. This will help determine any rule changes.
Reading the graph, show details
- You can expand the graph data by clicking on show details.
- This will display the data plus the option to export the data to CSV.
- You can click on each entry to expand the information.
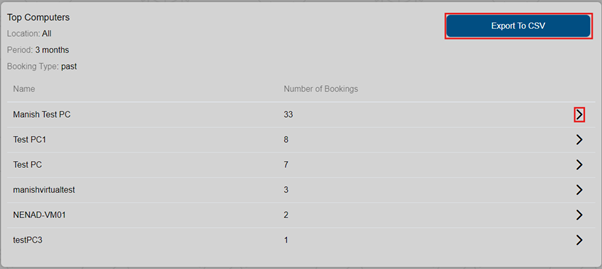
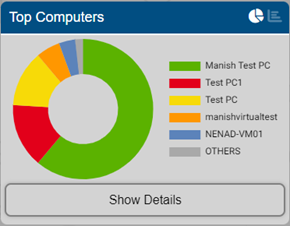
Computer reports
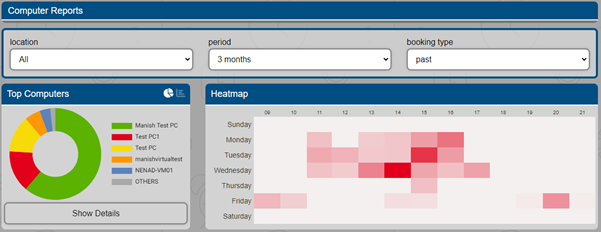
You can change the location, period you wish to see and booking type. You can also change which graph format you prefer.
Changing the location
- Select the location you wish to report on, this can be for all locations or per location.

Changing the period
- Select the length of time you wish you report on, this can be 1 month, 3 months, 6 months, and 1yr.

Changing the booking type
- Select from past or future bookings.

Changing the Graph format
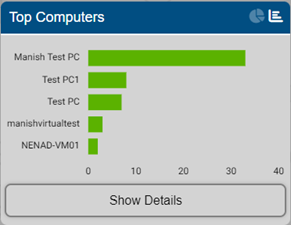
- There are two types of graphs you utilise, Pie or Bar.

- There is a heatmap available to show you which days are busier than others. This will help determine any rule changes.

Reading the graph, show details
- You can expand the graph data by clicking on show details.
- This will display the data plus the option to export the data to CSV.
- You can click on each entry to expand the information.